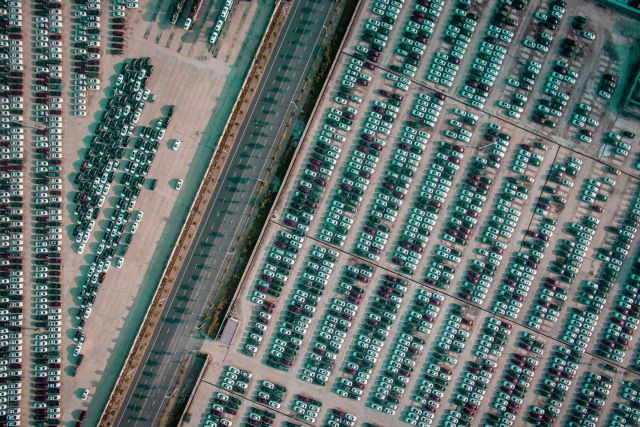
Although it’s not one of the largest manufacturers or importers of vehicles in the world, the industry does play a significant role in the worldwide chain not to mention that it is one of the key pillars of the South African economy, growing in stature and as a contributor to the country’s GDP over the years.
During its early years, naamsa’s achievements laid the groundwork for the growth and regulation of the automobile sector in the country, and the organisation is celebration its 90th birthday this year.
Investment by the seven original equipment manufacturers (OEMs), with technology embedded
investment, amounted to R7.3 billion in 2024. The OEMs are Toyota, Volkswagen, Isuzu, BMW, Mercedes-Benz, Ford and Nissan.
Add to this the vehicle importers’ investment in infrastructure like plants for semi-knocked down kits, part warehouses, dealerships, training facilities and other projects and the role of the automotive industry in South Africa’s economy is crucial.
- This table provides some interesting statistics as to the magnitude of the South African automotive industry and the change between 2023 and 2024 and takes note of the declining numbers for the local sales and exports last year compared to 2023.
Indicator |
2023 |
2024 |
Broader automotive industry contribution to GDP |
5.3% |
5.2% |
Vehicle and component production as % of South Africa’s manufacturing output |
21.9% |
22.6% |
Average monthly employment by vehicle manufacturers |
33 509 |
33 154 |
Automotive component sector employment |
82 560 |
81 860 |
Capital expenditure – vehicle manufacturers |
R5.2 billion |
R7.3 billion |
Capital expenditure – component sector |
R4.2 billion |
R2.95 billion |
Total South African new-vehicle sales |
531 552 units |
515 850 units |
Total South African vehicle production |
632 362 units |
599 754 units |
South Africa’s vehicle production as % of Africa’s vehicle production |
54.1% |
50.9% |
South Africa’s global vehicle production ranking |
22nd |
21st |
South Africa’s global vehicle production market share |
0.67% |
0.65% |
Vehicle ownership ratio per 1 000 persons |
182 |
180 |
Vehicle parc (number of registered vehicles) |
13.13 million |
13.36 million |
Total automotive export revenue |
R270.8 billion |
R268.8 billion |
Automotive export revenue as % of total South African export revenue |
14.7% |
14.7% |
Number of export destinations |
148 |
155 |
Number of export destinations with export values more than doubling year-on-year |
29 |
39 |
Top automotive export destination in Rand-value terms |
Germany |
Germany |
Total South African vehicle exports |
399 809 units |
390 844 units |
Value of vehicle exports |
R203.9 billion |
R205.4 billion |
Top vehicle export destination in volume terms |
Germany |
Germany |
Value of automotive component exports |
R66.9 billion |
R63.4 billion |
Top automotive component export category in Rand-value terms |
Catalytic converters |
Catalytic converters |
Top automotive trading partner (imports and exports) in Rand-value terms |
Germany |
Germany |
Top automotive trading region (imports and exports) in Rand-value terms |
EU |
EU |
Top country of origin for total automotive imports in Rand-value terms |
Germany |
Germany |
Top country of origin for vehicle imports |
India |
India |
Source: Econometrix, naamsa/Lightstone Auto, NAACAM, OICA, SARS, StatsSA.