
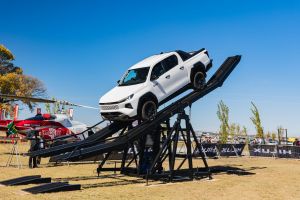
Bakkies take centre stage at Nampo 2026
Nampo Harvest Day near Bothaville in the Free State has always been the place where South Africa’s farming community gathers to see the latest machinery and, importantly, new bakkies.
- Industry News
- 13 May 2026
I am not sure that the true effect of stock holding is often appreciated when it comes to the financial performance of your vehicle departments. The model below is simplified as it is meant to show the effect of stock levels on financial performance.

As a result, I have assumed that the stock is 100% funded and that overheads are 60% of GP. All values in light, cursive type with the *asterisk in front, are inputs which can be changed if you want to use your own numbers in this model.
I have included both Return on Sales and Return on Investment in the analysis as they are both relevant measures. Return on Sales is the profit on the vehicle retained after deducting all overheads and interest expressed as a percentage. Return on Investment is the profit on vehicle retained as a percentage of the cost of the vehicle expressed as an annualised percentage – much like the interest you would earn on your bank account.
I don’t think the numbers need too much explanation as they speak for themselves. Given the risk, investment and effort required to run “vehicle sales” it is almost not worth being in the business with a stock holding over 45 days. This model can be applied to individual vehicles which hopefully shows what overage stock really does cost you.
|
Stock Days |
30 |
45 |
60 |
90 |
|
Interest Rate |
*10% |
*10% |
*10% |
*10% |
|
Monthly Units |
*40 |
*40 |
*40 |
*40 |
|
Ave Sales Price/Unit |
*R500 000 |
*R500 000 |
*R500 000 |
*R500 000 |
|
COS/Unit |
R460 000 |
R460 000 |
R460 000 |
R460 000 |
|
Overhead % of GP |
*60% |
*60% |
*60% |
*60% |
|
GP% |
*8% |
*8% |
*8% |
*8% |
|
Stock Holding as per Stock Days |
R18 400 000 |
R27 600 000 |
R36 800 000 |
R55 200 000 |
|
Monthly Interest |
R151 233 |
R226 849 |
R302 466 |
R453 699 |
|
Interest Per Vehicle |
R3 781 |
R5 671 |
R7 562 |
R11 342 |
|
GP/Unit Pre Int |
R40 000 |
R40 000 |
R40 000 |
R40 000 |
|
GP/Unit After Int |
R36 219 |
R34 329 |
R32 438 |
R28 658 |
|
GP% After Int |
7.2% |
6.9% |
6.5% |
5.7% |
|
Overhead /Unit |
R24 000 |
R24 000 |
R24 000 |
R24 000 |
|
Net Profit/Unit |
R12 219 |
R10 329 |
R8 438 |
R4 658 |
|
Return on Sales |
2.4% |
2.1% |
1.7% |
0.9% |
|
Return on Investment |
31.9% |
26.9% |
22.0% |
12.2% |
|
Dept NOP/Year |
R5 865 205 |
R4 957 808 |
R4 050 411 |
R2 235 616 |
If you would like the Excel spreadsheet to input your own numbers or if you have any questions or comments, please WhatsApp me on 0827761887.
Nampo Harvest Day near Bothaville in the Free State has always been the place where South Africa’s farming community gathers to see the latest machinery and, importantly, new bakkies.

Two leading Springbok rugby players, Aphelele Fassi and Jordan Hendrikse, have taken delivery of their new Nissan Navara Pro4X bakkies in Durban.

Dealership service departments know the pattern: the moment warranties and service plans expire; a portion of owners quietly migrate to the independent aftermarket.
 Advertisement
Advertisement
Advertisement
Have you ever noticed that anybody driving slower than you is an idiot, and anyone going faster than you is a maniac?
George Carlin
Dealership service departments know the pattern: the moment warranties and service plans expire; a portion of owners quietly migrate to the independent aftermarket.

Mercedes-Benz Vans South Africa announced its top-performing Agents and Dealers for 2025, recognising their exceptional dedication, customer service and commitment to the brand.

In today’s automotive retail environment, where new vehicle prices keep climbing beyond the reach of many consumers, used vehicles have become the backbone of dealership profitability.